The 30-Year System Failure: Why Creative Can't Function Financially—And Why Creative CPM Fixes It
How a structural measurement gap created the paradox that creative is proven to work, yet keeps getting cut.
The Paradox: Forty Years of Proof. Zero Credibility.
For forty years, research has proven that creative drives measurable value. The IPA (Institute of Practitioners in Advertising) documented it. McKinsey quantified it. Interbrand valued it. The Cost of Dull (2023) showed the cost of not investing in it: loss of differentiation, logo homogenization, and the slow death of distinctive brand communication.
Yet despite this evidence, creative budgets keep getting cut.
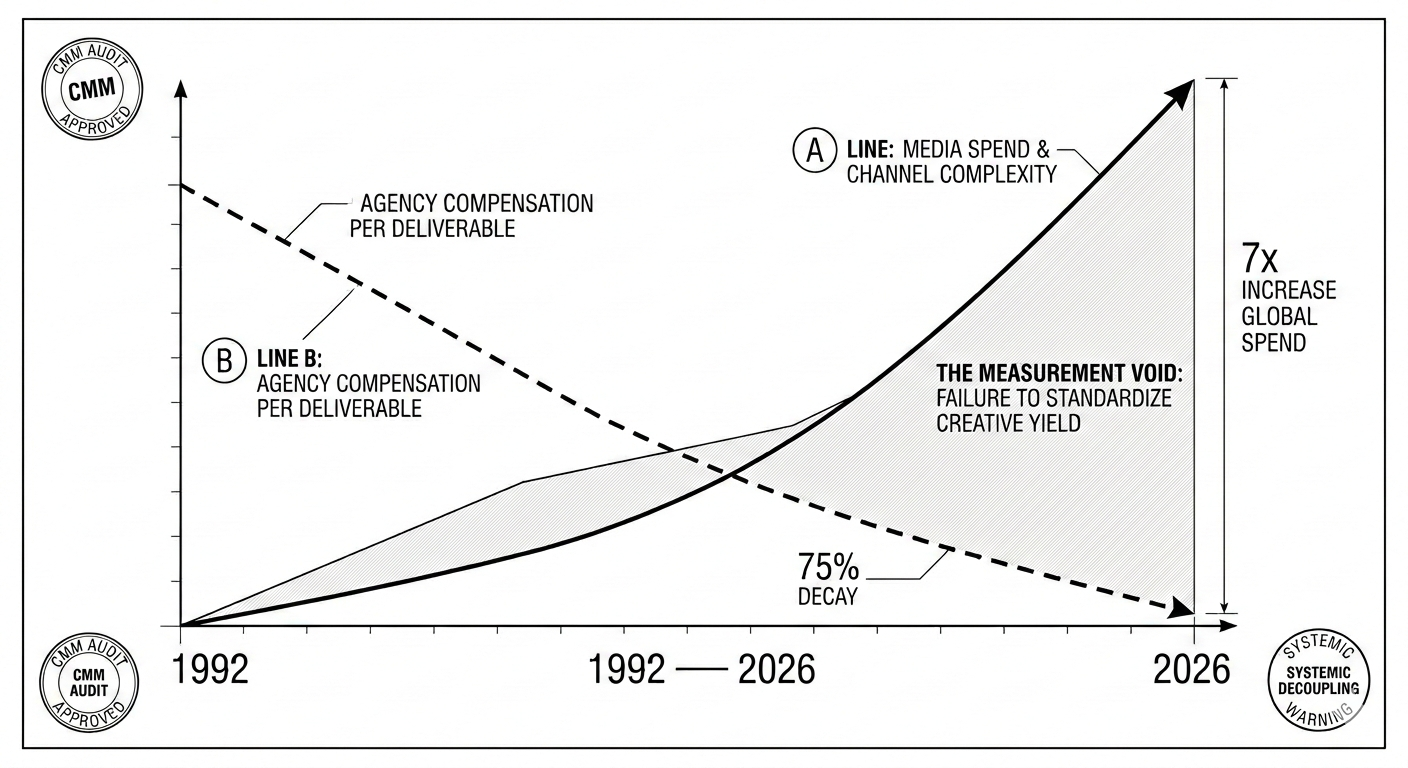
Michael Farmer's research (2026) shows that creative agency pricing has declined 75% in real terms over 33 years—from $435,000 to $110,000 per ScopeMetric Unit. Meanwhile, global media spend increased 7x over the same period. Creative investment collapsed while media investment exploded.
Dr. Augustine Fou's analysis of 15 years of public revenue data (2009-2024) reveals the consequence: 30 of the top 60 US advertisers grew at only 0.7% per year—below inflation—despite massive budget shifts into performance marketing and digital. These brands cut creative and awareness investment, over-shifted to performance marketing targeting the 1% of existing customers, and got stagnant growth in return.
The core problem:
Creative is proven to work. Yet it keeps getting cut.
Why?
Because creative lacks financial credibility.
The System Failure: How Two Languages Stopped Talking
1990s-2000s: The Divergence
Media discovered how to price itself with financial language. CPM (cost per thousand impressions). ROAS (return on ad spend). Efficiency metrics. Media could be measured, compared, and defended financially.
Creative, meanwhile, was priced by labor costs.
What did it cost to make? That became the value assigned to creative.
The result: Two measurement systems. One financial (media). One operational (creative). They couldn't talk to each other.
2010s onwards: The Hierarchy
Marketing ROI systems built around media metrics. Performance could be measured. Creative could not—at least not in the same language. This created an invisible hierarchy:
If you can measure it financially, it's defendable. If you can't, it's expendable.
The data pattern is stark: Despite IPA research (2007), McKinsey research (2015, 2023), Interbrand studies (2020), and The Cost of Dull (2023) all proving creative's financial impact, creative reallocation continued through 2024.
Why? Because research ≠ financial language. Proof ≠ credibility in a system that only speaks money.
The Hidden Logic: Why This Matters
This isn't about CFOs being wrong. It's about a structural gap.
When a CMO can't articulate creative's value in financial terms, the CFO has two choices:
Trust research (which takes time, requires education, feels risky)
Trust metrics (which are immediate, proven, defensible)
Most choose option 2.
This is why The Cost of Dull (2023)—solid research showing homogenization costs brands—changed nothing. Research is correlational. Financial language is directional. CFOs need language, not correlations.
Enter: Creative CPM
Creative CPM changes this by giving creative the financial language it should have always had.
It's not new theory. It's new architecture.
Step 1: Gather Historical Campaign Data
- Start with 1 audit (see it applied to your work)
- Then 3-4 audits (see it applied across different campaigns)
- Establish a benchmark and direct teams based on outcome focus
- Pattern emerges: which creative variables drive which outcomes
Step 2: Map Outcomes (Media Outcomes Creative Drives)
Not all outcomes are created equal. Which does your creative directly affect?
- Engagement (clicks, shares, time-spent)
- Brand lift (aided/unaided awareness, brand preference)
- Share of voice (editorial coverage, earned media)
- Customer acquisition cost improvement
- Pricing power
- Retention lift
Step 3: The System Calculates (Not You)
The conversation happens between us and your brand/agency team. We determine which outcomes matter most for your category. Then the methodology applies market-based CPM pricing:
- Benchmarked against media CPMs — each outcome type is assigned a financial value per thousand, using media pricing as the baseline reference
- Adjusted for engagement depth — a video view is valued differently than an impression, reflecting actual business value
- Weighted by conversion contribution — each outcome is weighted based on how it drives business results in your category
- Calibrated by geography and category — adjusted to reflect market conditions specific to where you operate and compete
The result: What Creative CPM emerges from the data. The system does the heavy lifting. You get the clarity.
Step 4: Creative ROAS Emerges
The multiplier becomes visible: How much financial outcome does each dollar of creative investment generate?
This is Creative CPM in action. Creative now has financial language. And financial language is defendable.
The Strategic Implication: Team Alignment
This changes team alignment fundamentally.
For decades, creative and media teams optimized separately. Different briefs. Different metrics. Different success definitions. They competed for the same budget instead of working toward shared outcomes.
Creative CPM aligns them. Both teams now optimize toward: "What's the best creative + media mix to maximize this outcome?"
Not creative vs. media. Creative + media, co-dependent on delivering shared objectives.
This is what marketers have wanted for decades: integrated strategy with credible measurement.
The Next War vs. The Last War
Most marketers are still fighting the last war (data and measurement) while the next war (AI-driven performance commoditization) is arriving.
McKinsey (2024) documented that 94% of organizations are unprepared for AI-driven commoditization of performance marketing. The data is stark: performance channels are already commoditizing. Volume, not pricing, is the constraint. By 2026, programmatic efficiency will be table-stakes—meaning every dollar in performance media will deliver similar results regardless of which platform manages it.
Creative becomes the only lever left. When performance is algorithmic, when media buying is automated, when channel parity exists—the only remaining source of differentiation is creative distinctiveness. This is why IPA data shows creatively awarded campaigns achieve 8-11x effectiveness: they're winning in a world where media buying has been commoditized.
But here's the catch: Brands that can't defend creative financially will compete on price, not differentiation. Farmer's research shows the pattern: as creative compensation collapsed 75% while media spend exploded 7x, brands cut creative investment to chase performance efficiency. The result: more undifferentiated work, increased commoditization, stagnant growth despite massive spend. This is the doom loop Dr. Fou documented—30 top brands grew at 0.7% annually despite shifting billions into performance.
The brands abandoning creative measurement today are the ones most vulnerable to this collapse tomorrow. They'll have no creative advantage when performance becomes worthless as a differentiator.
Creative CPM 1.0: The Beginning
Creative CPM isn't a finished product. It's Creative CPM 1.0—the initial capability is complete, but the service and product will build, learn, and grow over time.
This is an act of leverage: using creative measurement to unlock creative's full potential. It's a journey of test and learn to use creative expression in the most powerful ways possible—something not systematically done with media, performance, or production in over 30 years.
What This Enables
Teams Defend Creative Financially
Finally, creative has the language your CFO needs to say yes.
Allocation Becomes Data-Driven
Instead of default cuts, you decide based on creative performance and financial impact.
Creative and Media Align
Both teams optimize toward the same outcomes instead of competing for budget.
Creative Multiple Improves
Not because creative works better. Because it finally has credibility.
Sources
- Michael Farmer - "Price Premiums Are the Ultimate Measure" (2026): Research documenting creative agency compensation decline from 1992-2026, showing 75% real-term reduction in price per ScopeMetric Unit (from $435,000 to $110,000). substack.com
- Statista Global Advertising Market: Historical and projected global advertising spending data, 1992-2026. Shows 7x increase in total ad spend globally over 34 years. statista.com
- Galbithink Annual U.S. Advertising Expenditure: Historical U.S. ad spending data since 1919, used to establish baseline 1992 spend figures. galbithink.org
- Dr. Augustine Fou Revenue Analysis (2024): Analysis of 15 years of public revenue data (2009-2024) showing 30 of top 60 US advertisers achieved only 0.7% annual growth despite massive budget reallocation to performance marketing and digital channels.
- The Cost of Dull (2023): Industry research documenting loss of brand differentiation through logo homogenization and decline of distinctive creative communication. Published by System1 and Eat Big Fish / Adam Morgan collaboration. system1group.com
- Binet & Field - "The Link Between Creativity and Effectiveness" & "The Crisis in Creative Effectiveness" (IPA): Landmark research using the IPA Effectiveness Awards databank showing creatively awarded campaigns were 11x more efficient at driving market share growth than non-awarded campaigns. However, "The Crisis in Creative Effectiveness" (1996-2018) reveals this advantage has weakened from 12x (2011) to 6x (2016) due to industry short-termism and activation-only focus. Yet high-performing, creatively awarded campaigns following long-term brand-building best practice still achieve 8x effectiveness and 16x likelihood of major profit growth. ipa.co.uk
- McKinsey - "Past Forward: The Modern Rethinking of Marketing's Core": Research on creative effectiveness impact on brand value, market performance, and ROI in modern marketing. mckinsey.com
- LIONS Creativity Report Series - "Go For Growth" (2023): Commissioned by Cannes Lions and featuring research on 50 Lion-winning brands from publicly traded companies (~40,000 data points). Headline finding: in the 12 months after winning a Lion, these "most creative" companies achieved +2.7% increase in EBIT and +4.7% increase in market capitalization above exchange-traded average. The report documents how brands like Cadbury (generosity platform driving $1B+ revenue, 35% growth in specific campaigns), Brahma (barrier reframing achieving 39% sales increase), and Renault (category leadership) achieved sustained business growth through consistent creative excellence. canneslions.com